ESG DataE:Related to environment data
- SG Holdings「ESG Book」
- Sagawa Express ESG Data 2024
- Information on Environmental Load Across Business Activities
- Input of Resources
- Output of Environmental Load
- Reduction effect
- Environmental accounting
For "S: Social data" and "G: Governance data", please refer to each page of SG Holdings.
SG Holdings「ESG Book」
Key data found in the information disclosed in various reports and websites published by SG Holdings has been compiled in the ESG Book.
Sagawa Express ESG Data 2024
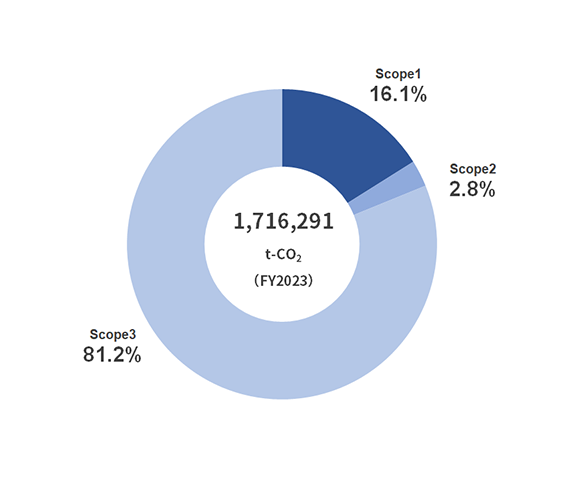
Information on Environmental Load Across Business Activities (FY2023)
Reporting period : FY2023 (April 1, 2023 through Mar 31, 2024)
The following indicates the FY2023 results of resources Sagawa Express invested into its business activities (input) and burdens on the environment created by its emission (output).
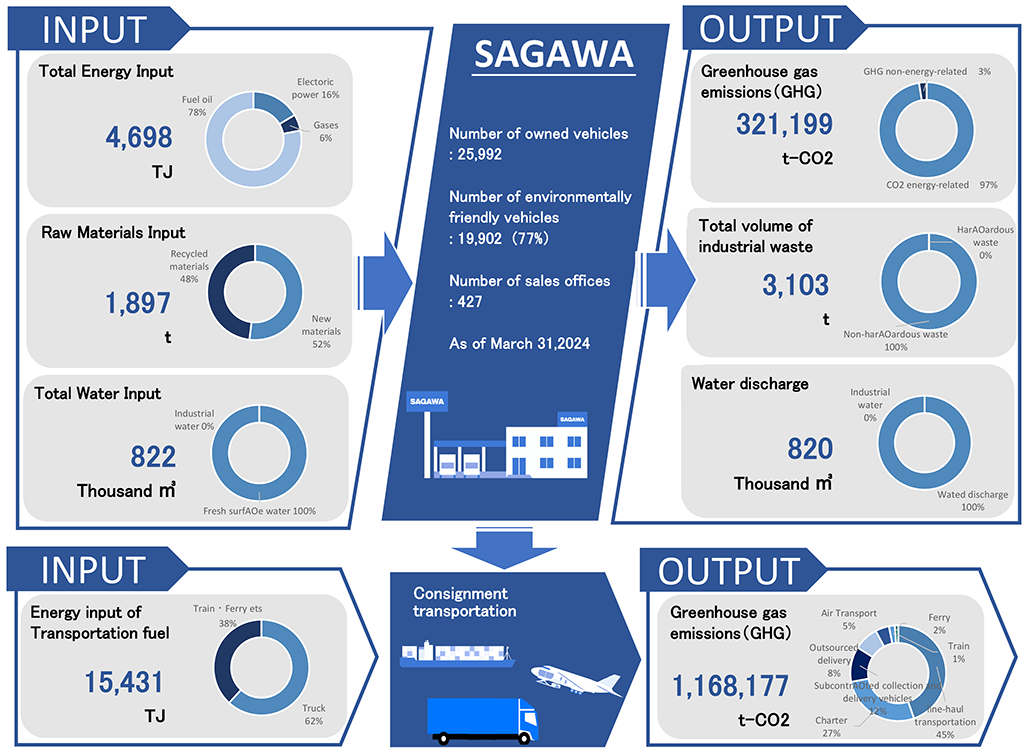
Total Resource Inputs(INPUT)
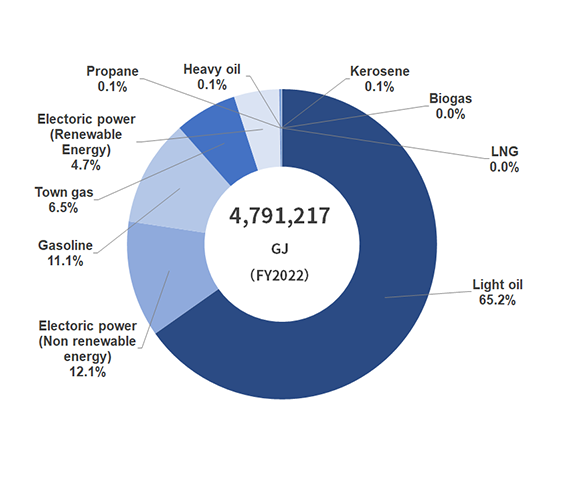
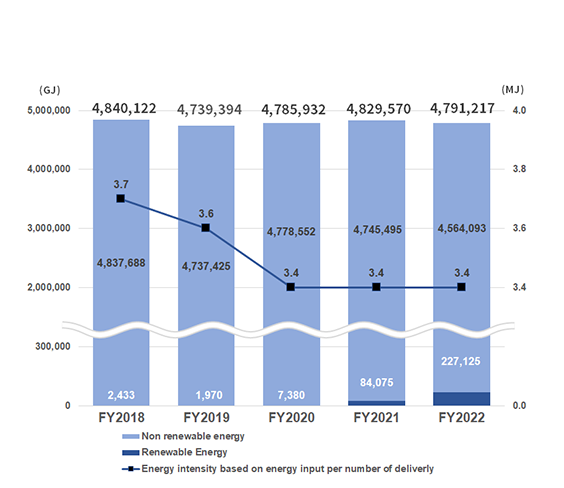
Total Energy Input
| Unit | FY2019 | FY2020 | FY2021 | FY2022 | FY2023 | |||
|---|---|---|---|---|---|---|---|---|
| Renewable Energy | Electoric power | GJ | 1,137 | 6,352 | 83,266 | 226,630 | 395,526 | |
| Biogas | GJ | 833 | 1,028 | 809 | 495 | 672 | ||
| Hydrogen | GJ | - | - | - | - | 559 | ||
| Non renewable energy | Electoric power | GJ | 739,050 | 754,288 | 712,248 | 581,158 | 377,950 | |
| Town gas (City gas) | GJ | 536,738 | 461,102 | 371,552 | 311,431 | 252,821 | ||
| Propane | GJ | 7,493 | 6,902 | 6,195 | 5,509 | 4,986 | ||
| LNG | GJ | 1,256 | 1,060 | 435 | 0 | 0 | ||
| Light oil | GJ | 2,867,891 | 2,961,829 | 3,081,909 | 3,125,687 | 3,171,499 | ||
| Gasoline | GJ | 576,109 | 585,157 | 565,833 | 533,262 | 486,798 | ||
| Kerosene | GJ | 4,665 | 4,499 | 3,530 | 3,292 | 3,198 | ||
| Heavy oil | GJ | 4,223 | 3,715 | 3,793 | 3,754 | 3,734 | ||
| Total | GJ | 4,739,394 | 4,785,932 | 4,829,570 | 4,791,217 | 4,697,742 | ||
| Energy intensity based on energy input per number of deliverly | MJ | 3.6 | 3.4 | 3.4 | 3.4 | 3.4 | ||
- Boundary /Scope of coverage: SAGAWA EXPRESS CO.,LTD (All business sites inside Japan)
- No electric power sales
Calculation method
- Electricity: Calculated using unit conversion from MWh to GJ (3.6 GJ/MWh) (Electricity energy conversion factors changed retroactively to 2018)
- Fuel, gas: Calculated using the applicable factors, etc. in the "List of Calculation Methods and Emission Coefficients in Calculation, Reporting and Publication Systems" based on the Act on Promotion of Global Warming Countermeasures
- City gas uses 44.8GJ/thousand m3
- Energy intensity: Energy input (Unit:MJ)/(Number of home deliverly (Unit: Number) +Number of mail delivery (10 pieses of mail delivery convert to 1 home delivery))
Raw Materials Input
| Unit | FY2020 | FY2021 | FY2022 | FY2023 | |||
|---|---|---|---|---|---|---|---|
| Procurament of raw materials and parts (Packing material) | Paper | New materials | kg | 1,272,242 | 1,116,284 | 976,551 | 885,495 |
| Recycled materials | kg | 911,119 | 882,881 | 962,102 | 824,290 | ||
| Poripuropiren | New materials | kg | 69,883 | 64,494 | 48,393 | 57,978 | |
| Recycled materials | kg | 0 | 0 | 0 | 0 | ||
| Sofkloth | New materials | kg | 10,545 | 1,101 | 1,816 | 1,693 | |
| Recycled materials | kg | 0 | 0 | 0 | 0 | ||
| Poriechiren | New materials | kg | 14,494 | 8,109 | 12,466 | 22,667 | |
| Recycled materials | kg | 47 | 74 | 159 | 99 | ||
| Cotton | New materials | kg | 791 | 0 | 0 | 0 | |
| Recycled materials | kg | 0 | 0 | 0 | 0 | ||
| Polyester | New materials | kg | 159 | 265 | 437 | 407 | |
| Recycled materials | kg | 0 | 0 | 0 | 0 | ||
| Polyolefin | New materials | kg | 0 | 8,080 | 8,242 | 7,011 | |
| Recycled materials | kg | 0 | 0 | 0 | 0 | ||
| Recycled material ratio | % | 40 | 42 | 48 | 46 | ||
| Raw materals (uniform) | Polyester | New materials | kg | 2,945 | 4,114 | 1,403 | 8,489 |
| Recycled materials | kg | 29,439 | 28,018 | 15,725 | 88,069 | ||
| Cotton | New materials | kg | 414 | 1,173 | 43 | 259 | |
| Recycled materials | kg | 589 | 1,639 | 65 | 367 | ||
| Poriuretan | New materials | kg | 69 | 95 | 31 | 176 | |
| Recycled materials | kg | 0 | 0 | 0 | 0 | ||
| Recycled material ratio | % | 90 | 85 | 91 | 91 | ||
- Boundary /Scope of coverage: SAGAWA EXPRESS CO.,LTD (All business sites inside Japan)
Calculation method
- Caluculated based on recycled material ratio
- Partially revised the 2020 data for raw materials (uniform) published in the past
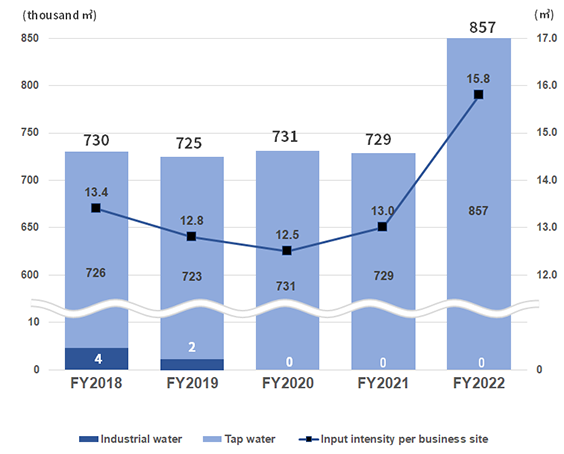
Total Water Input
| Unit | FY2019 | FY2020 | FY2021 | FY2022 | FY2023 | |
|---|---|---|---|---|---|---|
| Tap water | thousand m3 | 723 | 731 | 729 | 857 | 822 |
| Industrial water | thousand m3 | 2 | 0 | 0 | 0 | 0 |
| Input intensity (per employee) | m3 | 12.8 | 12.5 | 13.0 | 15.8 | 15.7 |
| Total | thousand m3 | 725 | 731 | 729 | 857 | 822 |
- Boundary /Scope of coverage: SAGAWA EXPRESS CO.,LTD (All business sites inside Japan)
- The scope of data collection has been expanded to include small stores that are tenants from the 2022 data compilation
- For some business sites for which actual water input cannot be tracked, the calculation is based on intensity per unit of floor area
- Confirmed that water sources that are not significantly affected by water intake are not applicable through evaluating and confirming the risk of water (Quantitative risks) piriodically by using Water risk map "AQUEDUCT" prepared by "World Water Resources Institute
- Intensity: Total Water Input(unit :m3)/number of employees
Output of Environmental Load(OUTPUT)
Greenhouse gas Emissions(GHG)
| Unit | FY2019 | FY2020 | FY2021 | FY2022 | FY2023 | ||||
|---|---|---|---|---|---|---|---|---|---|
| Scope1 | CO2 energy-related |
Light oil | t-CO2 | 196,264 | 202,693 | 210,910 | 213,906 | 218,648 | |
| Gasoline*1 | t-CO2 | 38,629 | 39,236 | 37,940 | 35,756 | 33,376 | |||
| Natural gas | t-CO2 | 24,863 | 20,847 | 16,491 | 13,653 | 11,403 | |||
| Biodiesel (20% bio-based content) | t-CO2 | - | - | - | - | - | |||
| LNG | t-CO2 | 62 | 52 | 21 | 0 | 0 | |||
| Kerosene | t-CO2 | 316 | 305 | 240 | 223 | 219 | |||
| Heavy oil A | t-CO2 | 293 | 257 | 263 | 260 | 264 | |||
| City/Town gas | t-CO2 | 1,854 | 2,105 | 2,004 | 1,849 | 1,554 | |||
| Propan gas | t-CO2 | 443 | 408 | 366 | 325 | 298 | |||
| GHG non-energy-related |
HCFC*2 | t-CO2 | 187 | 123 | 2 | 45 | 0 | ||
| HFC*3 | t-CO2 | 6,340 | 5,530 | 5,889 | 5,857 | 5,913 | |||
| Dry ice | t-CO2 | - | - | 2,263 | 2,468 | 2,318 | |||
| Scope1 Total | t-CO2 | 269,251 | 271,557 | 276,389 | 274,344 | 274,011 | |||
| Scope2 | CO2 energy-related | Electricity | t-CO2 | 100,182 | 91,559 | 83,188 | 69,440 | 47,188 | |
| Scope3 | Total Scope3 | t-CO2 | 962,084 | 1,123,640 | 1,064,132 | 1,372,508 | 1,383,588 | ||
| Total | Scope1,2 | t-CO2 | 369,433 | 363,116 | 359,577 | 343,783 | 321,199 | ||
| Scope1,2,3 | t-CO2 | 1,331,518 | 1,486,756 | 1,423,710 | 1,716,291 | 1,704,787 | |||
| Sales Intensity | Greenhouse Gas Emissions Sales Intensity*4 | t-CO2 | 0.38 | 0.35 | 0.34 | 0.32 | 0.31 | ||
| Greenhouse Gas Emissions Number of Courier Service Intensity*5 | g-CO2 | 280.9 | 257.6 | 250.4 | 241.1 | 230.9 | |||
| Vehicle Emission Intensity | g-CO2 | 197.5 | 186.5 | 184.8 | 184.6 | 189.3 | |||
| Emission Intensity other than Vehicle | g-CO2 | 83.3 | 71.2 | 65.6 | 56.4 | 41.5 | |||

- Boundary /Scope of coverage: SAGAWA EXPRESS CO.,LTD (All business sites inside Japan)
- Dry ice has been included since FY2021, and biodiesel (20% bio content) since FY2023.
-
*1include high octane gasoline
-
*2HCFC
-
*3HFC
-
*4Intensity: Total CO2 emissions (The sum of Scope1 and Scope2 Unit: t) / Operating revenue (Unit: Million Yen)
-
*5Intensity: Total CO2 emissions (The sum of Scope1 and Scope2 Unit: t) / (Number of courier service (Unit: Quantity) + Number of mail delivery (10 piece of mail deliveries convert 1 courier))
Calculation method
- Scope1: CO2 emissions from the combustion of biogenic biogas (31,770 m3) are excluded.
- Scope1 Fuel, Gas: Calculated by multiplying the amount of fuel and gas used by the applicable factors, etc. in the "List of Calculation Methods and Emission Coefficients in Calculation, Reporting and Publication Systems" based on the Act on Promotion of Global Warming Countermeasures
- Scope1 HFC(Freon gas): Calculated by multiplying the amount of leakage of each type of fluorocarbon, etc. by the global warming factors determined based on the Act on Promotion of Global Warming Countermeasures
- Scope2 Electricity: Calculated by multiplying the amount of electricity used by the applicable factors, etc. from "Emission Factors by Electric Utility Operator (for Calculating GHG Emissions of Specific Emitters) – FY2022 Results – Dec. 12, 2023" published by the Ministry of the Environment and the Ministry of Economy, Trade and Industry. (For emission factors at business sites where the electricity supplier is unknown, the "national average factor" for the subject fiscal year is used.)
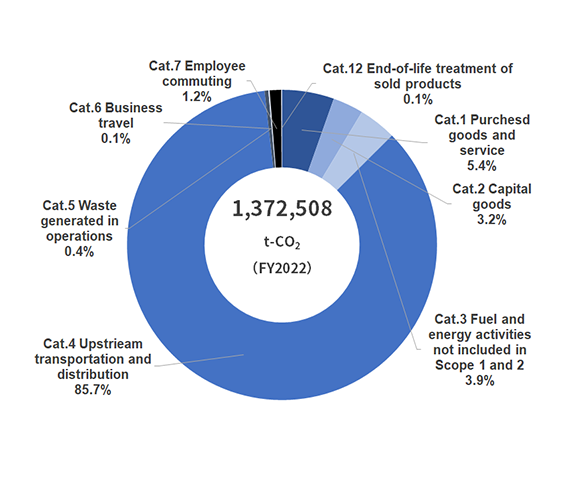
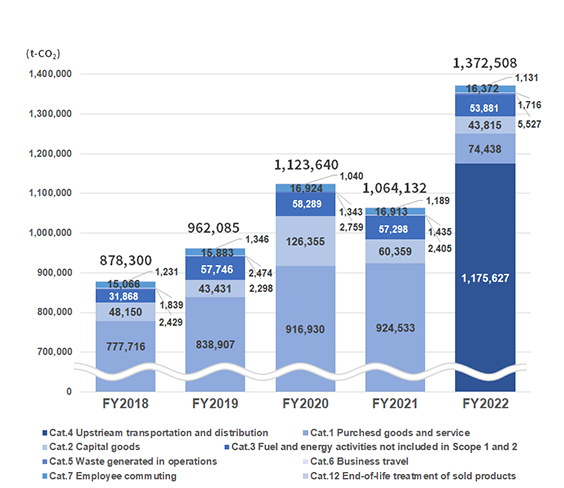
Scope3 CO2Emissions
| Unit | FY2019 | FY2020 | FY2021 | FY2022 | FY2023 | ||
|---|---|---|---|---|---|---|---|
| Cat.1 | Purchesd goods and service | t-CO2 | 838,907 | 916,930 | 924,533 | 74,438 | 80,016 |
| Cat.2 | Capital goods | t-CO2 | 43,431 | 126,355 | 60,359 | 43,815 | 55,839 |
| Cat.3 | Fuel and energy activities not included in Scope 1 and 2 | t-CO2 | 57,746 | 58,289 | 57,298 | 53,881 | 55,562 |
| Cat.4 | Upstrieam transportation and distribution | t-CO2 | Included in calculation of Scope1 | 1,175,627 | 1,168,177 | ||
| Cat.5 | Waste generated in operations | t-CO2 | 2,298 | 2,759 | 2,405 | 5,527 | 5,108 |
| Cat.6 | Business travel | t-CO2 | 2,474 | 1,343 | 1,435 | 1,716 | 1,753 |
| Cat.7 | Employee commuting | t-CO2 | 15,883 | 16,924 | 16,913 | 16,372 | 15,998 |
| Cat.8 | Upstream transportation and distribution | - | Included in calculation of Scope1 | ||||
| Cat.9 | Downstream transporation and distribution | - | Included in calculation of Scope1 | ||||
| Cat.10 | Processing of sold products | - | Not applicable for processing of sold products | ||||
| Cat.11 | Use of sold products | - | Sold products are corrugated cardboard and other packaging materials, the use of which generates no CO2 emissions. | ||||
| Cat.12 | End-of-life treatment of sold products | t-CO2 | 1,346 | 1,040 | 1,189 | 1,131 | 1,135 |
| Cat.13 | Downstream leased assets | - | Included in calculation of Scope 2 | ||||
| Cat.14 | Franchises | - | No applicable franchises | ||||
| Cat.15 | Investments | - | Not related to Sagawa Express business (not an investment enterprise) | ||||
- Boundary /Scope of coverage: SAGAWA EXPRESS CO.,LTD (All business sites inside Japan)
- Some of the calculation methods and categories for Scope 3 have been changed from the FY2022 data compilation (mainly Categories 1, 4, and 5).
(Example: The scope of emissions related to outsourced transportation, which had been included in Category 1 until FY2021, was reviewed in light of the actual status of transactions, and the category was changed to Category 4 from FY2022.)
Conversion factor calucurating CO2 emissions in scope3
| Category | Boundary /Scope of coverage/Calculation method ・Conversion factor | |
|---|---|---|
| Cat.1 | Purchesd goods and service |
|
| Cat.2 | Capital goods |
|
| Cat.3 | Fuel- and energy-related activities not included in Scope1 or Scope2 |
|
| Cat.4 | Upstrieam transportation and distribution |
|
| Cat.5 | Waste generated in operations |
|
| Cat.6 | Business travel |
|
| Cat.7 | Employee commuting |
|
| Cat.8 | Upstream transportation and distribution | Calculated by including Scope1 |
| Cat.9 | Downstream transporation and distribution | Calculated by including Scope1 |
| Cat.10 | Processing of sold products | Processing of sold products not applicable. |
| Cat.11 | Use of sold products | As only packing materials such as cardboard boxes are applicable to sold products, there are no CO2 emissions from use. |
| Cat.12 | End-of-life treatment of sold products |
|
| Cat.13 | Downstream leased assets | Included in calculation of Scope 2 |
| Cat.14 | Franchises | No applicable franchises |
| Cat.15 | Investments | Not related to Sagawa Express business (not an investment enterprise) |
Greenhouse Gas Emission Verification Statement
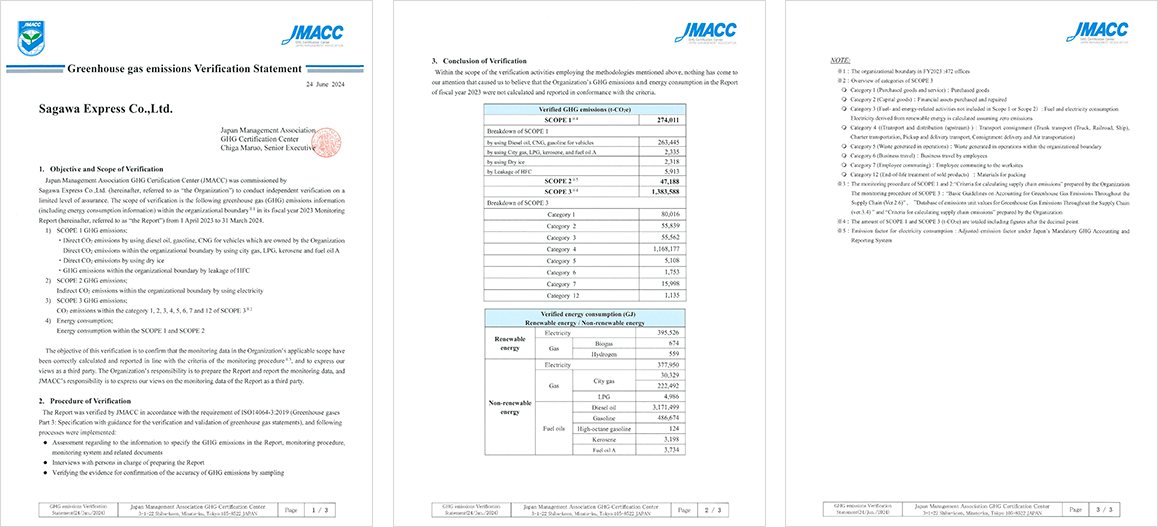
Greenhouse Gas Emission Verification Statement (English)
Total Volume of Industrial Waste
| Unit | FY2019 | FY2020 | FY2021 | FY2022 | FY2023 | |
|---|---|---|---|---|---|---|
| Non-harzardous waste | t | 4,408 | 5,169 | 4,385 | 3,899 | 3,102 |
| Harzardous waste | t | 0.01 | 1.15 | 0.84 | 10.55 | 0.94 |
| Total | t | 4,408 | 5,170 | 4,386 | 3,909 | 3,103 |
| Total amount of waste discharged for business site intnesity | t | 5.4 | 6.4 | 5.4 | 4.9 | 3.9 |
| Final disposal amount | t | - | 1,339 | 1,154 | 1,026 | 842 |
| Amount of used products collected and recycled | t | - | 3,906 | 3,588 | 3,739 | 5,713 |
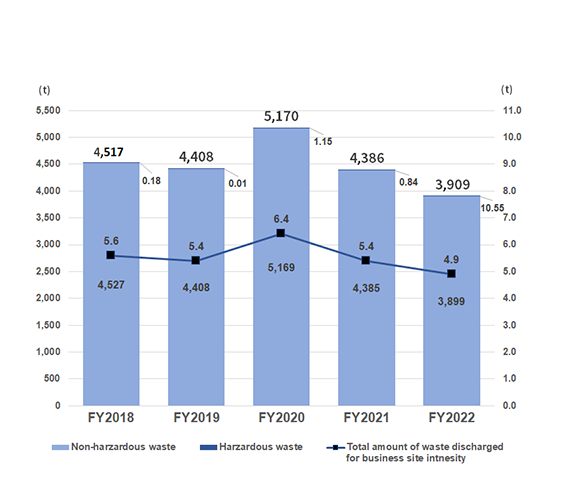
- Boundary /Scope of coverage: SAGAWA EXPRESS CO.,LTD (All business sites inside Japan)
- Hazardas waste is special controlled industorial waste established by Japane Waste Disposal Law
- Intensity : Total industrial waste emissoins (Unit : t)
- Amount of used products collected and recycled: Amount of waste plastic (stretch film and PP bands) and corrugated cardboard collected
Water Discharge
| Unit | FY2019 | FY2020 | FY2021 | FY2022 | FY2023 | |
|---|---|---|---|---|---|---|
| Wated discharge | thousand m3 | 726 | 729 | 725 | 855 | 820 |
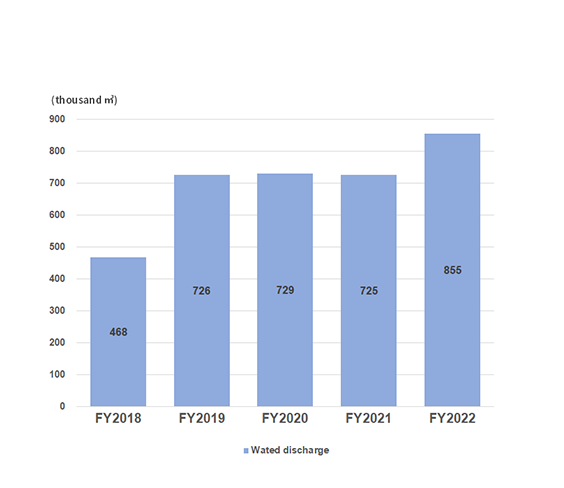
- Boundary /Scope of coverage: SAGAWA EXPRESS CO.,LTD (All business sites inside Japan)
- The scope of data collection has been expanded to include small stores that are tenants from the 2022 data compilation
- For some business sites for which actual water discharge cannot be tracked, the calculation is based on intensity per unit of floor area
- Beginning in FY2019, sites for which wastewater discharges could not be monitored were also included in the calculation, with the water inputs considered as wastewater discharges.
Cemical Substances Discharge
| Unit | FY2019 | FY2020 | FY2021 | FY2022 | FY2023 | |
|---|---|---|---|---|---|---|
| NOx emissions(NOx) | t | 266 | 230 | 214 | 166 | 142 |
| PM emissions(PM) | t | 5 | 5 | 4 | 4 | 3 |
| SOx emissions(SOx) | t | 0 | 0 | 0 | 0 | 0 |
| VOC emissions(VOC) | t | 0 | 0 | 0 | 0 | 0 |
- Boundary /Scope of coverage: Vehicles (excluding light vehicles) used by Sagawa Express Co., Ltd. (All business sites inside Japan)
Calculation method
- Coefficient is used by Automobile Usage Management Plan Report of Ministry of Land, Infrastructure, Transpoet and Tourism
NOx Value Average(g/kWh)
| Unit | FY2019 | FY2020 | FY2021 | FY2022 | FY2023 | |
|---|---|---|---|---|---|---|
| NOx value average | g | 0.3 | 0.2 | 0.2 | 0.2 | 0.2 |
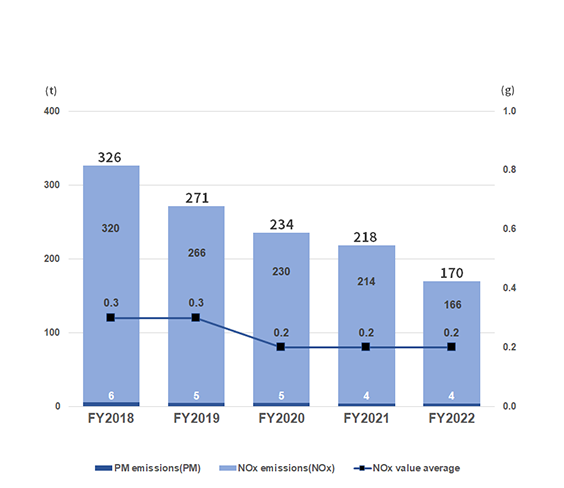
- Boundary /Scope of coverage: SAGAWA EXPRESS CO.,LTD (All business sites inside Japan)
- Energy input (diesel, gasoline, natural gas) has been calculated by converting total GJ to kWh
Reduction Effect
Energy Reduction Contribution
| Unit | FY2019 | FY2020 | FY2021 | FY2022 | FY2023 | |
|---|---|---|---|---|---|---|
| Number of LED lighting systems installed | case | 79 | 77 | 1 | 0 | 19 |
| Energy consumption reduction due to introduction of LED lighting systems |
GJ | 29,824 | 58,221 | 38,969 | 0 | 3,631 |
- Reduction in electricity consumption thanks to installation of LED lighting systems (The number of cases installed to FY2015~FY2023 was 405)
- Reduction effect for one year from the month of installation is calculated
Calculation method
- Electoricity : Appended Table 3 of Ordinance for Enforcement of the Act on the Rational Use of Energy.
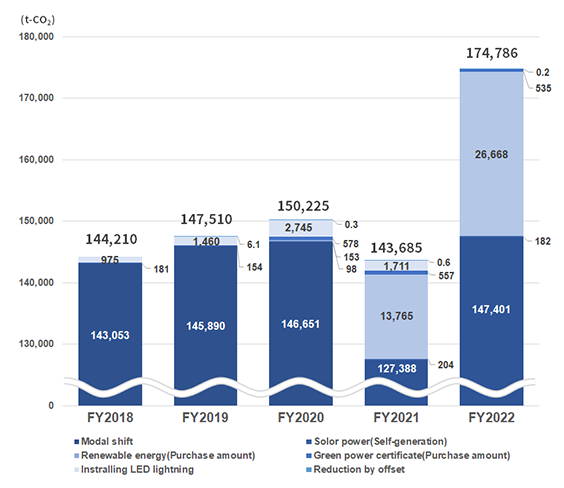
Greenhouse gas Emission(GHG) Reduction
| Unit | FY2019 | FY2020 | FY2021 | FY2022 | FY2023 | ||
|---|---|---|---|---|---|---|---|
| Scope1 | Modal shift | t-CO2 | 145,890 | 146,651 | 127,388 | 147,401 | 137,536 |
| Scope2 | Solor power | t-CO2 | 154 | 98 | 204 | 182 | 145 |
| Renewable energy(Purchase amount) | t-CO2 | 0 | 153 | 13,765 | 26,668 | 47,439 | |
| Green power certificate(Purchase amount) | t-CO2 | 0 | 578 | 557 | 535 | 539 | |
| Instralling LED lightning | t-CO2 | 1,460 | 2,745 | 1,771 | 0 | 160 | |
| Offset | Reduction by offset | t-CO2 | 6.1 | 0.3 | 0.6 | 0.2 | 0.3 |
| Total | t-CO2 | 147,510 | 150,225 | 143,685 | 174,786 | 185,818 | |
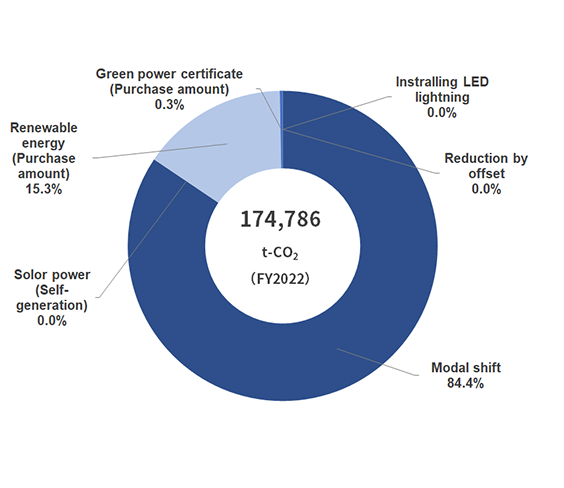
- Boundary /Scope of coverage: SAGAWA EXPRESS CO.,LTD (All business sites inside Japan)
Calculation method
-
Scope1 Modal shift
Greenhouse gas reduction effect from Environmental load without Modal Shift is calcurated
Greenhouse gas emission per freight volume announced by Ministry of Land Infrastructure, Transport and Tourism -
Scope2 Solor power energy
Business sites with solar power generation equipment are 23 business sites
Emissions factors for each business site from Ministeral Ordinance on Calculation of Greenhouse Gas Emissions Arising from the Business Activities of Specified Emitters. -The Ministry of the Environment and Ministry of Economy, Trade and Industry. -
Scope2 Renewable energy, Green Energy Certificates
Purchased renewable energy and Green Energy Certificates
Using the emissions factors by electricity business (for calculating GHG emissions of specified emitters) published by the Ministry of the Environment and the Ministry of Economy, Trade and Industry -
Scope2 Installing LED lightning
Effect when compared with the the previous year of LED introduction
Emissions factors for each business site from Ministeral Ordinance on Calculation of Greenhouse Gas Emissions Arising from the Business Activities of Specified Emitters. -The Ministry of the Environment and Ministry of Economy, Trade and Industry.
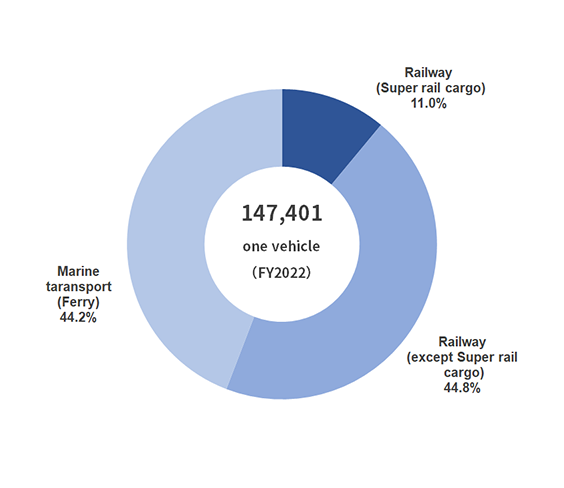
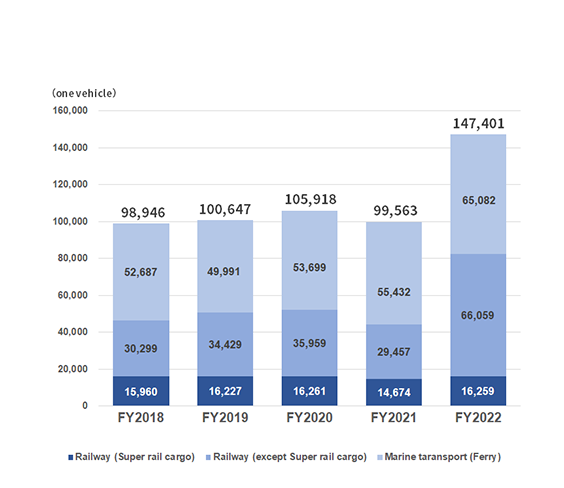
Number of Track Reduction Through Modal Shift
| Unit | FY2019 | FY2020 | FY2021 | FY2022 | FY2023 | |
|---|---|---|---|---|---|---|
| Railway (Super rail cargo) | one Super rail cargo | 16,227 | 16,261 | 14,674 | 16,130 | 16,076 |
| Railway (except Super rail cargo) | one except Super rail cargo | 34,429 | 35,959 | 29,457 | 32,267 | 30,968 |
| Marine taransport (Ferry) | one Ferry | 49,991 | 53,699 | 55,432 | 65,788 | 65,227 |
| Total | one vehicle | 100,647 | 105,918 | 99,563 | 114,184 | 112,271 |
Calculation method
- Refer to CO2 emission intensity (g-co2/tonKm) "CO2emissions per transport volume" published by Ministry of Land, Infrastructure, Transport and Tourism
Environmental Accounting
Environmental Protection Costs
| Category | Major activities | Unit | FY2022 | FY2023 | |||
|---|---|---|---|---|---|---|---|
| Environmental investment | Environmental cost | Environmental investment | Environmental cost | ||||
| (1)Costs inside business area/ Business area cost | Millions JPY | 234 | 1,345 | 482 | 1,409 | ||
| 1. Pollution prevention cost | Air pollution, water pollution, noise prevention (Soundproof wall, Installation of car wash equipment etc.) | Millions JPY | 2 | 6 | 1 | 4 | |
| 2. Global environmental | Preventing global warming and destraction of the ozone layer (Natural gas trucks, Solor power system, installing energy-saving equipment etc.) | Millions JPY | 230 | 326 | 480 | 332 | |
| 3. Resource circulation costs | Waste disposal, Water saving, Recycling tire etc. | Millions JPY | 2 | 1,013 | 1 | 1,073 | |
| (2)Up/Downstream costs | Promotion of green purchasing | Millions JPY | - | 357 | - | 419 | |
| (3)Administration costs | Implemantaion of an environmental management systems, Environmental advertising, environmental traingi of employees, Disclosure of environmental information | Millions JPY | - | 9 | - | 8 | |
| (4)R&D costs | Developing servces that contribute to environmental conservation | Millions JPY | - | 17 | - | 4 | |
| (5)Social activity cost | Donation or financial support of environmental group inside/outside country, enlightment activities | Millions JPY | - | 10 | - | 12 | |
| (6)Environmental remediatrion cost | Asbestos dust countermeasures cost | - | - | - | - | - | |
| (7)Safety measures cost | Vehicle inspection as safety measures, employee education, enhancement activities | Millions JPY | - | 5,586 | - | 5,763 | |
| Total | Millions JPY | 234 | 7,324 | 482 | 7,616 | ||
- Calculation of upstream/downstream costs and green purchasing promotion from FY2021
Overall Environmental Conservation Benefit
| Environmental performance indicators | Unit | FY2022 | FY2023 | Environmental Protection Effects (FY2021-FY2022) |
|
|---|---|---|---|---|---|
| Light oil | kl | 82,909 | 83,460 | -551 | |
| Kerosene | kl | 90 | 88 | 2 | |
| Heavy oil | kl | 96 | 96 | 0 | |
| Natural gas*1 | thousand m3 | 6,122 | 5,562 | 560 | |
| LNG | kg | 0 | 0 | 0 | |
| City/Town gas*2 | thousand m3 | 829 | 758 | 71 | |
| Propane gas*3 | kg | 108,440 | 99,514 | 8,926 | |
| Gasoline | kl | 15,412 | 14,575 | 837 | |
| Electoricity | kWh | 161,430,000 | 104,990,000 | 56,450,000 | |
| Renewable energy*4 | Solor paower self-generation | kWh | 420,000 | 330,000 | 330,000 |
| Purchased | kWh | 62,540,000 | 109,540,000 | 109,540,000 | |
| Water (Tap water) | thousand m3 | 857 | 822 | 35 | |
| Water (Wast water) | thousand m3 | 855 | 820 | 35 | |
| Industrial water (Clean water) | thousand m3 | 0 | 0 | 0 | |
| Industrial water (Wasted water) | thousand m3 | 0 | 0 | 0 | |
| PET bottle recycling amount*4,5 | number | 581,944 | 365,240 | 365,240 | |
- Boundary /Scope of coverage: SAGAWA EXPRESS CO.,LTD (All business sites inside Japan)
- Overall environmental protection effects are calculated comparing with increases/decrease in FY2022
-
*1Natural gas consumption at on-premises gas stations is calculated after temperature and pressure compensation.
-
*2City gas is calculated using the figures on invoices from suppliers without temperature and pressure compensation.
-
*3「2.07kg/m3」numbers (m3) listed at invoce from supplier was used to weight conversion.
-
*4The environmental conservation effects of renewable energy and the PET bottle recycling amount are calculated using actual values.
-
*5Effects that are thought to have contributed to the recycling of PET bottles were described by converting to the number of PET by using uniforms made from PET bottles. (Conversion value: Uniform weight (short sleeve: approx. 175 g; long sleeve: approx. 240 g) x Number of uniforms x Amount of polyester used per uniform (cotton: 65%; sweat-absorbing and quick-drying: 100%) x 1 (recycling rate of polyester used: 100%) ÷ 30 (weight of a 500 ml PET bottle: 30 g)
Calculation method
- References : Environmental Accounting Guidelines 2005 edition by Ministry of the Environment JAPAN
- Record acuisition of assets of 200,000 yen or more as investment
- Dipreciation of environmenta facilities /equipment is 4 years flat-rate repuriciation
- Laber cost is calucurated based on the formura :enviromnmental activities time×average laber cost per person